
Rotational Rheometer- HAAKE MARS II
|
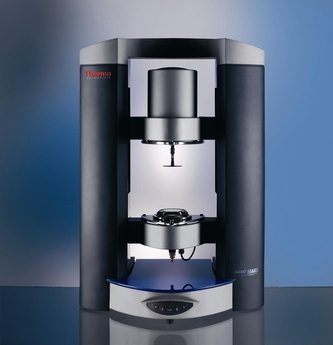
This is the rotational rheometer being used in the experiment. It is built by thermoscientific and is one of their MARS range. The name “MARS” reflects the philosophy of the product: the “Modular Advanced Rheometer System”. The HAAKE MARS can can cover all rheological measurements in the “CR” (controlled rate), “CS” (controlled stress), and “CD” (controlled deformation) modes in rotation. The HAAKE has a motor which can control speed, torque and therefore deformation while measuring all other variables(See Rheometers). Readings can be taken of pressure forces between –50N and +50N and transfers data every 2 ms when time–dependent phenomena are being measured. The unit also has a temperature control unit which currently is not working. This will make ensuring the test sample is at body temperature more difficult but will be discussed in sources of error.
|
|
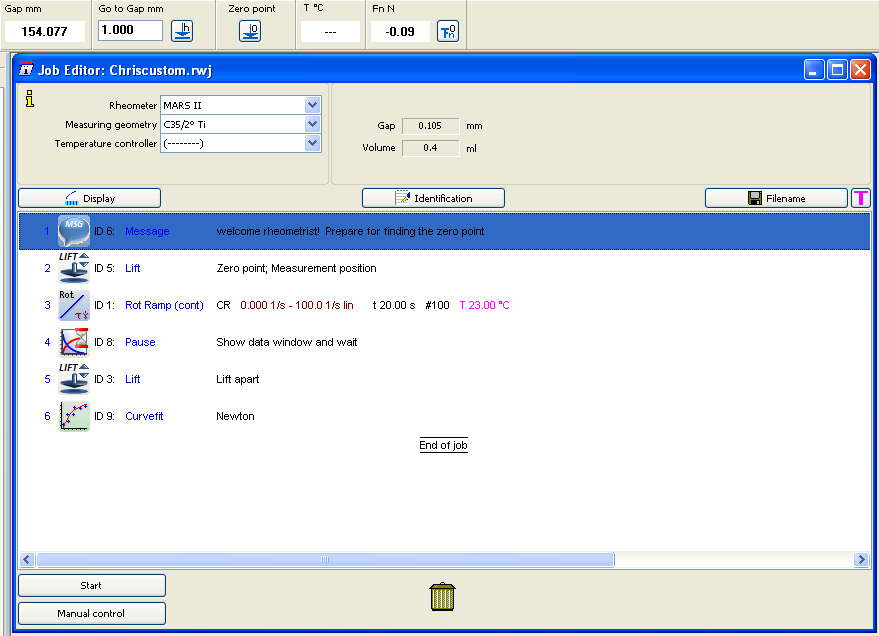
Rheowin SoftwareThe HAAKE MARS rheometer is operated through a PC. Software is provided by to allow the user to set up fully customisable experiments. The user interface is split in three operations managers to allow the user have control of different elements of the experiment and equipment. These are:
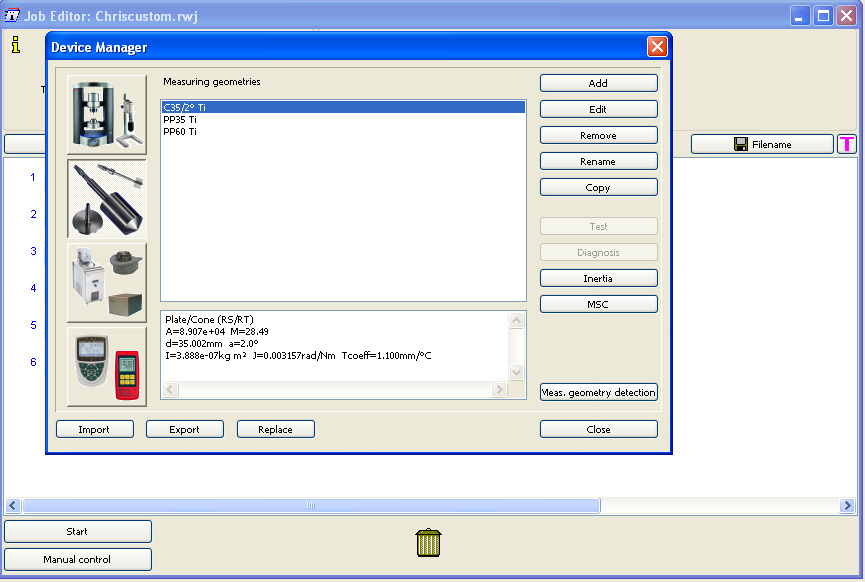
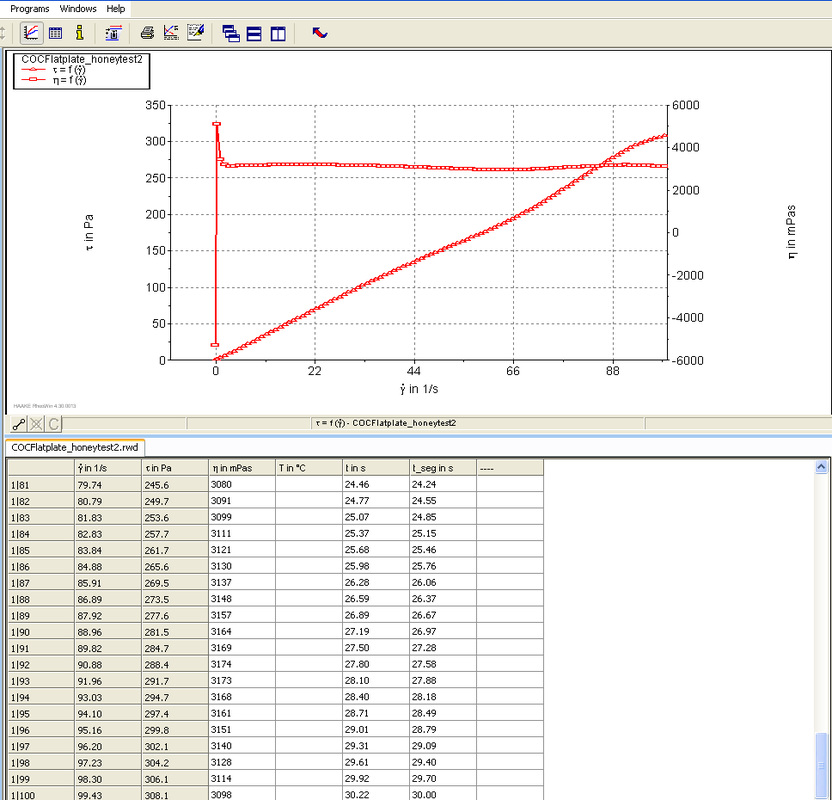
User Manager is for simply allowing multiple users to use the unit and still keep their customisable settings, as well as protecting their work. Device Manager is where all the predefined parameter of the experiment are set up. In this section the user -chooses the measuring head -enters the temperature control spec. -enters any modifications needed to measurement process for attachments to the device eg. pressure system. Job Manager is the area where the experiment is set up by inserting elements (commands) into a command line as seen on the right. These commands are split into three groups: -General Used for calibration,movement of measuremnt unit,entering prompt messages etc. -Measurement Is where the actual measurent tasks are entered to be completed. -Evaluation Where the form of data presentation is chosen Data Manager is where all the graphs and data is viewed.In this area it is possible to create curve fits and change scales. All post data collection activities are done in this manager |
|
